Downtime
We’ve had our worst week yet for uptime in Harmony. We’ve long prided ourselves on our stability, but we failed this week. Here’s what happened.
First, we’ve been seeing a large increase in traffic over the last month. While many new sites are launching, and older sites are gaining in popularity, we can scale with growth easily. This was an increase in malicious spam traffic. We’ve had a few times where requests (mostly admin pages) would time out, or hang, while a burst of traffic was being dealt with.
On Monday, we got hit unexpectedly with DNS errors. Our DNS provider, Zerigo, was affected by a massive denial of service attack and we got caught realizing that 5 DNS hosts isn’t enough if they’re all under attack. At the same time, many of you use Zerigo for your own DNS, compounding the problem.
Update: Zerigo has posted their write-up, explaining the outage.
After Zerigo recovered, we setup redundant DNS so that we won’t get caught in this situation again.
For the rest of the week, we continued to see an uptick in traffic. We asked our hosting company to bump up our resources yesterday, and planned on a quick and easy upgrade today. Before they even got into the office to do an upgrade this morning, the traffic spiked again, and a simple reboot wasn’t enough to restore service. The fine crew at RailsMachine responded by upgrading right then, and we were back to normal.
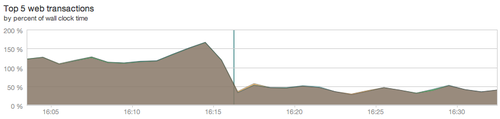
Usual requests to Harmony pages scale very well because we heavily cache responses. These spam requests were mostly HTTP POSTs, which were able to use more resources than a GET request that hits our cache layer. We worked through a careful fix and finally deployed it this afternoon.
This graph shows the instant relief we saw after deploying, represented by the blue bar.
We’re not pleased that we had any downtime. You depend on Harmony and we let you down.
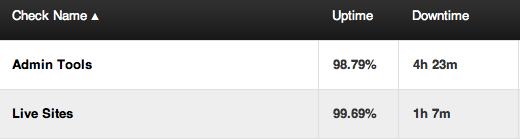
As a first step, we’ve launched a new public status page, powered by Pingdom, at status.harmonyapp.com

Eek, it doesn’t look very good today, but you can click into the details and see that we had 33 minutes of downtime on Live Sites today. Not good at all.
We also have a lot of monitoring tools in place, so we can respond within minutes. Our hope is to get our status page back to green. We also may iterate on our status to pull in data from other services, but we wanted to start being more transparent today.
We’re extremely sorry. We hope our new measures will keep us up and running, and transparency will help keep you informed. If you have any questions or concerns, don’t hesitate to contact us.